Designing Infographics
Students learn basic data analysis, visualization, methods for encoding data and approaches to designing visual stories using evidence. We discuss bias, methods of persuasion and analyze ethical representation using a wealth of contemporary and historic examples. Projects progress from data stories with a single assertion and visualization to infographics that include illustration and one or more visualizations to explain evidence.
Work by two students is included in the 2023 long list of the Information is Beautiful Awards!
Explaining Henry, Gil Pocaterra
Evolution of Female Participation in the Summer Olympics, Natasha Taylor
Edible Insects, Esther Provnost
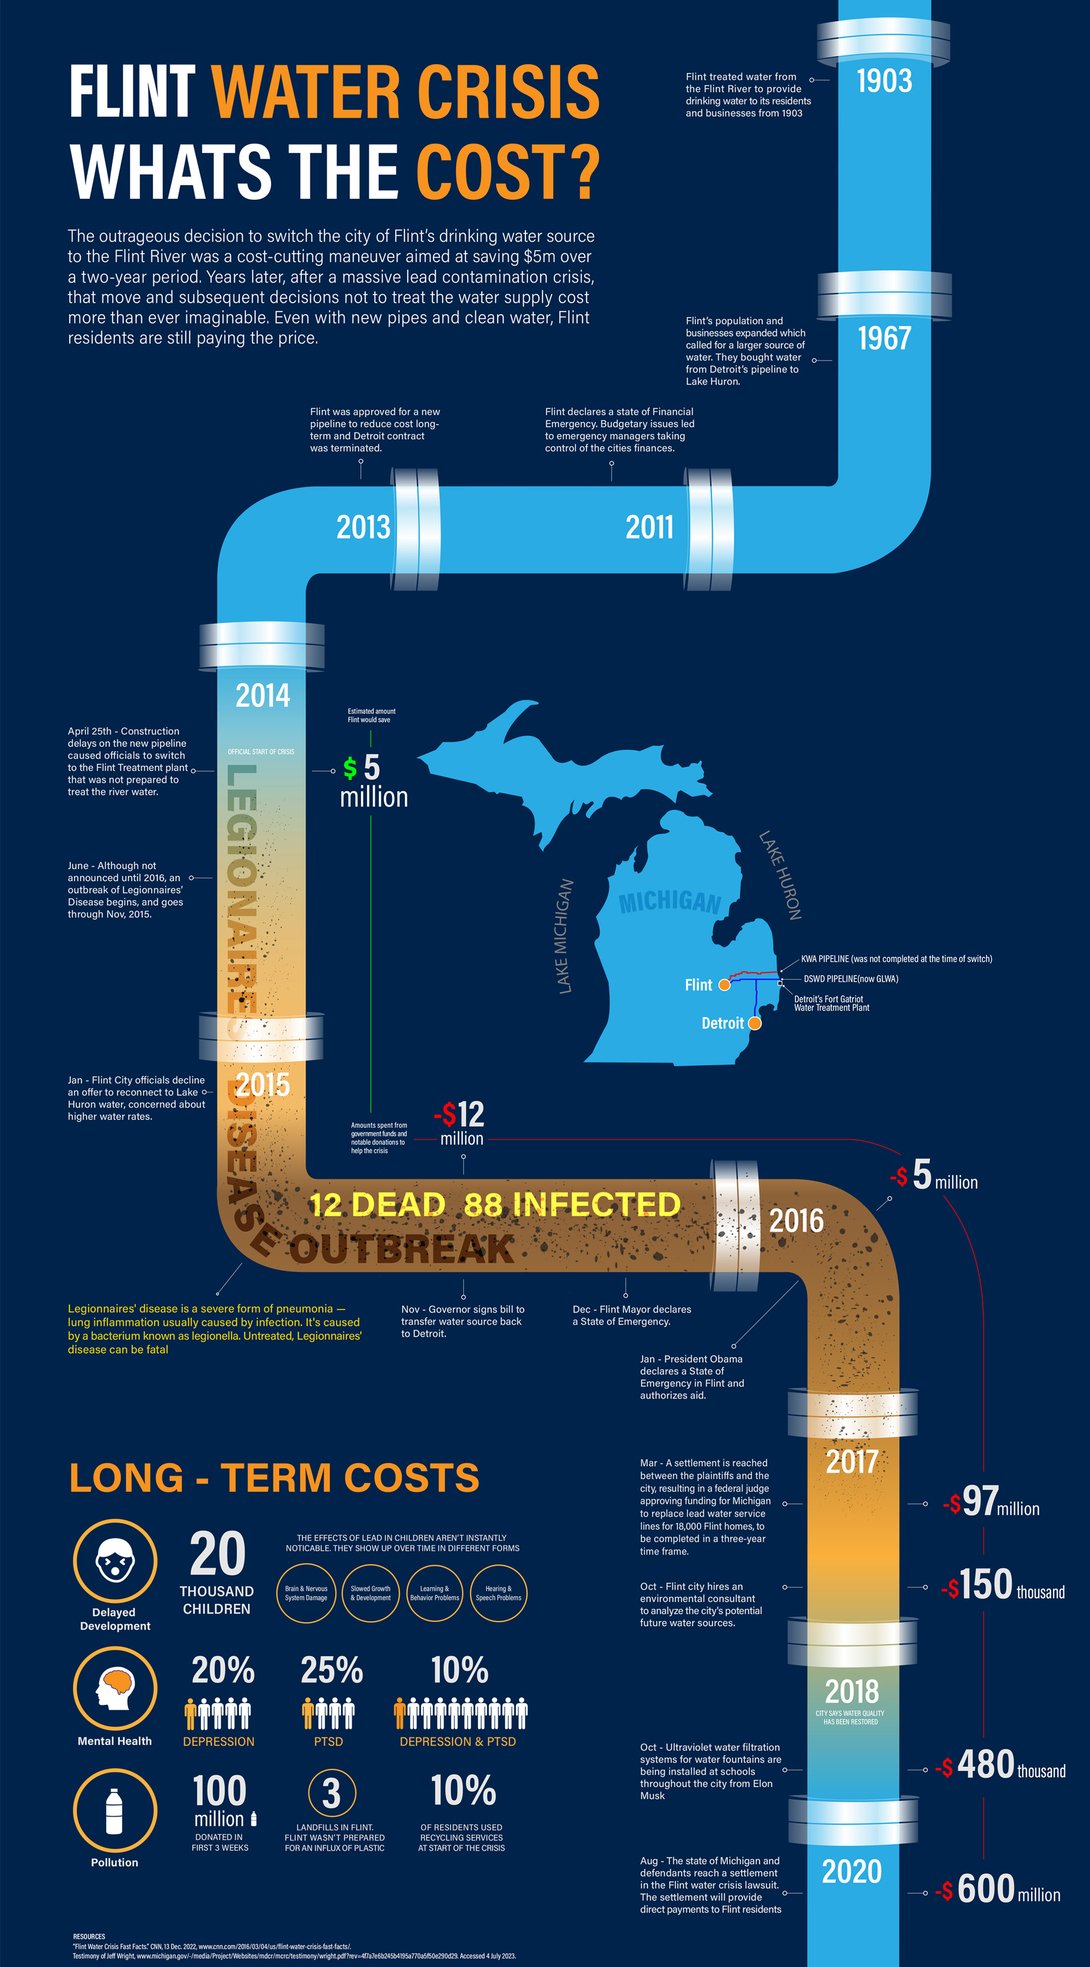
What's the Cost? Jon Lee (Longlisted)
Powerball Jackpot History, Fanshu Sun (Longlisted)
Why We Need to Care More About Neurodiverse Workers, Fanshu Sun
Shocking Find! Sixuan Meng
If you Want More Fiber, Just Reach Higher, Kelsey Dendrick
Somerville City of Underdogs, Rachel Newborn
Most Common Trees, Somverville, MA, Gil Pocaterra
5 Streets with the Most Trees in Somerville


